● What Is a Trading Range?
When stock charts don’t show uptrends or downtrends, they’re in a trading range. Trading ranges are periods of congestion during which stocks bounces up and down between support (bottom) and resistance (top) levels.
Let’s see an example below.
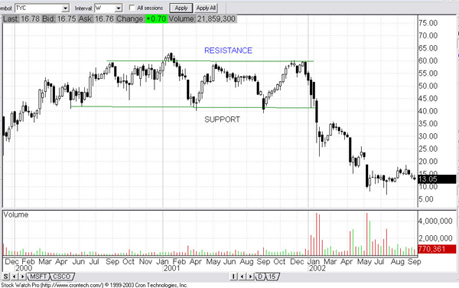
Fig 2.1
Figure 2.1 above is a stock chart of Tyco (TYC). As you can see, it bounced between about $40 and $60 from April 2000 until January 2002.
As a general rule, the more times a stock touches a support or resistance point, the more powerful it becomes, and the more meaningful it is if it breaks through those points.
In the case of Tyco above, when it finally broke below $40 around January 2002, the price subsequently collapsed, as is often the case when stocks break below support.
As you can also see, there were times when the stock went slightly above or below the support and resistance points but went back—you might call those times “fake outs.”
● When Support Becomes Resistance
If you look at stock charts enough, you’ll notice an interesting thing often happens after a break out of support or resistance—the old resistance becomes the new support and vice versa.
Below is an example:
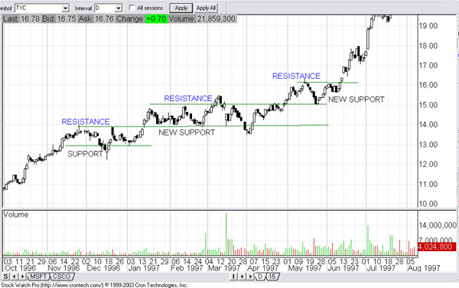
Fig 2.2
In Tyco’s (TYC) daily chart above, there are three different trading ranges shown. Observe that each time Tyco breaks above its resistance, that resistance become the new support.
The inverse happens just as frequently—after a break below support, the support becomes the new resistance.
Options
● How to Play Trading Ranges with Option Trades
If you want to play trading ranges, there are three ways:
- Buy and sell as the stock bounces off of its support and resistance.
Buy and sell as the stock breaks above or below its support and resistance.
- Make option trades to profit when the stock does not break out of the trading range
The first two pays are pretty self explanatory, but there is a third option which is a little bit more complicated—options. Option trades are a whole other topic in themselves, but here is a quick overview:
There are two types of options, calls and puts. By selling calls and puts, you can profit when a stock does not go above or below a certain point, or you can profit when a stock moves above or below a certain point.
At its most basic, calls give the buyer the right to buy a certain stock, at a certain price, by a certain date. Puts give the buyer the right to sell a certain stock, at a certain price, by a certain date.
For example, let’s say XYZ stock has gone up to $20. In the past few months, XYZ has gone up to $20 three times, but always drops back down, and you think it will again. You can make money in this situation selling call options, so long as XYZ doesn’t go above where you think it will.
What you can do is sell call contracts at, for example, $1 a piece, which expire in one month and give the buyer the right to buy XYZ from you at $23. If when that call option expires XYZ is not above $23, then the option will expire worthless. You’ll get to keep the $1 per contract you collected. On the other hand, if XYZ goes up to $30, the buyer of the call option can exercise it and demand you sell him XYZ at $23 when it’s really worth $30.
That was a simplistic example, and if you’d like to read more about options trades, do a search on your favorite search engine. There’s plenty to read. |