● What Are They?
An oscillator is a kind of stock market indicator that gives you trading signals. Chart programs generate them for you automatically. All you have to do is read them.
Like most things in this guide, we will only go over the most widely-used and accepted ones. We will also not go into the mathematics behind the oscillators, but if you would like to learn, references will be listed.
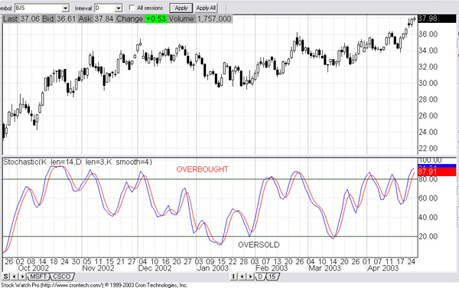
Stochastics
Fig 3.7 Click to Enlarge.
Notice that for Stochastics, 80 is the overbought level and 20 is the oversold level. Common usage dictates that if the lines go above 80, then the stock will likely drop. If the lines go below 20, then the stock will likely go up.
Another common usage of Stochastics is to buy when the K line (blue) crosses above the D line (red) and sell when the opposite happens.
MACD
MACD, which stands for “Moving Average Convergeance/Divergeance,” is another stock market indicator generator just like Stochastics, but it looks and acts slightly differently. Take a look below.
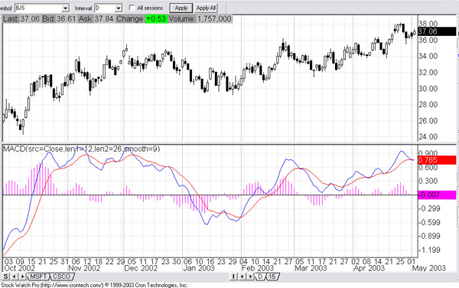
Fig 3.8 Click to Enlarge.
The most common usage of MACD is to buy when the pink bars cross above the middle “signal” line, and sell when they cross below.
Another way to use MACD is to establish your own overbought and oversold levels such as + 0.5 and - 0.5, then buy and sell according to the red and blue lines.
RSI
RSI, which stands for “Relative Strength Index,” is a stock market indicator developed by Welles Wilder in 1979. It was originally intended for use in commodities, but was found to be useful in stocks as well.
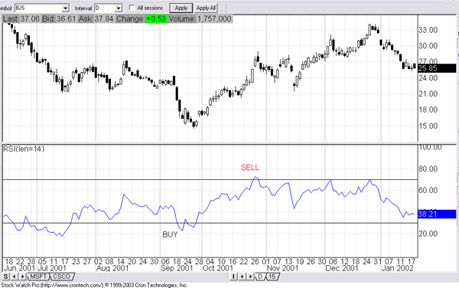
Fig 3.9 Click to Enlarge.
For the RSI, overbought and oversold levels are usually set at 70 and 30. When price goes above 70, it’s considered overbought, and when it goes below 30, it’s considered oversold.
Another way of using RSI is to look for divergences between the oscillator and the price. For example, if the price makes a new high, but the RSI fails to, it could signal an impending reversal.
Helpful Hints for Using Oscillators: Overbought and oversold levels work beautifully in a trading range, but they can be disastrous if used wrongly in a trend. During trends, the oscillators can read overbought or oversold for extended periods of time. So never take an oversold reading alone to mean that it’s time to buy. If a stock or currency is in the middle of a strong downtrend, the oversold indicator could stay that way for years.
So before you use an oscillator, first assess whether or not whatever you’re looking at is in a trend. If it’s trending, then it’s best to use overbought/oversold readings to time your entry and exits as you trade WITH the trend. So, for example, if you notice a strong uptrend, then so long as the uptrend is still valid, use oversold levels as entry points, and overbought levels for exit points.
No oscillator is perfect. You’ll never find the magic oscillator which gives completely accurate signals all the time. This is a game of probability. You want to use oscillators to increase your chances.
The best way to use oscillator signals is to combine them with other technical analysis readings. For example, if you notice a stock is bouncing off a resistance level, and the RSI reads overbought, then you might want to sell. Making decisions using a combination of factors increases your chances of winning.
There are over a hundred oscillators that exist. Some are popular some aren’t. You can even create your own oscillators on certain chart programs. Become familiar with the popular ones first, then venture into the unknown if you’d like. |